Algorithm Design Tools
1. Program Flowcharts
A visual representation of the sequence of steps within a single algorithm or module.
Terminator |
Start / End |
Process |
Calculation / Assignment |
I/O |
Input / Output |
? |
Decision (IF/Case) |
2. Structure Charts
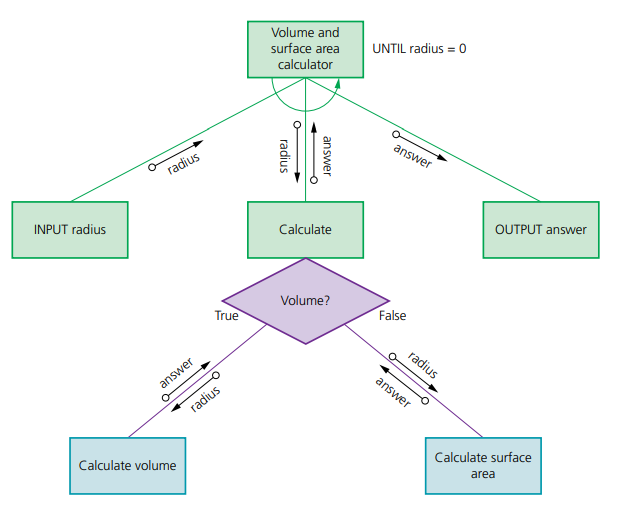
A diagram representing the hierarchy of modules and how data moves between them.
Unlike flowcharts, structure charts do not show the internal logic (loops/ifs), only the "Big Picture" architecture.
3. Structure Chart Notations
When drawing a structure chart for a modular program, we use specific arrows to show how data is passed:
○──→ (Data Couple): Represents a data parameter being passed (e.g., StudentName).
●──→ (Control Flag): Represents a status signal or boolean (e.g., IsFound or EOF).
Loop Symbol: A curved arrow over a line indicates that the sub-module is called inside a loop.
4. Selecting the Right Tool
- Use a Flowchart when you need to map out the detailed logic of a complex loop or a nested IF statement.
- Use a Structure Chart when you are planning a large system with many procedures and need to see how they interact.
In a Paper 2 exam, if a module calculates a value and sends it back to the main program, ensure your Data Couple arrow points UP toward the calling module.